
Chapter 16
Analysis of various predictors and outcomes for diabetes mellitus using the Structural Equation Model (SEM)
- Ayyakkannu Selvaraj (Associate Professor, IICT MGM University, chh.sambhajingar, Maharashtra )
- Anuradha Babasaheb Jadhav, (Teaching Assistant, IICT, MGM University, Chh.Sambhajinagar, MGM University )
- Sushma Adsul, (Assistant Professor, IICT, MGM University, Chh.Sambhajjnagar, Maharashtra )
- Pooja Hanamntrao Deshmukh (Teaching Assistant, IICT, MGM University, Chh.Sambhajinagar, Maharashtra )
- Pramila Kharat (Assistant Professor, IICT, MGM University, CSN, Maharashtra)
- Ujjwala Suresh Chaudhari (Assistant Professor,IICT,MGM University,Chh.Sabhajinagar,Maharashtra)
- ISBN
- 978-93-340-5069-1
- Published
- 29 September 2026
- Accesses
- 23 views · 0 downloads
- Reading time
- ~6 min
Abstract
The present study has aimed to assess the predictor’s variables using Structural Equation Model, which measures and analyzes the regression and correlation between independent and dependent variables. The statistical-based model deployed to investigate type 2 diabetes in the Pima Indian Diabetes database contains various factors such as the number of pregnancies the patient has had, their BMI, insulin level, age, and so on. The designed mode explores the linear relationship with those variables. Analyzing the data was carried out using a structural equation model. During the first analysis, various modification indices and estimates have been suggested, and since then, the model has been fit once necessary changes have been made. The probability level is increased substantially based on the outcome of the modification indices and estimate. The evaluation indicators such as the goodness of fit, Comparative fit index (CFI), Goodness-of-fit index (GFI), root mean square error of approximation (RMSEA), and chi-square index/df were assessed. The significance level in all tests was considered 0.05. The obtained results are in the prescribed range, such as RMSEA= 0.038, Critical ratio= 1.96, GFI=0.992, CFI=0.998, TLI=0.992, NFI=0.989, IFI=0.998. Keywords: Probability, Modification Indices, Root mean square error, Goodness of fit index.
Keywords: Probability, Modification Indices, Root mean square error, Goodness of fit index.
Full text
Abstract
The present study has aimed to assess the predictor’s variables using Structural Equation Model, which measures and analyzes the regression and correlation between independent and dependent variables. The statistical-based model deployed to investigate type 2 diabetes in the Pima Indian Diabetes database contains various factors such as the number of pregnancies the patient has had, their BMI, insulin level, age, and so on. The designed mode explores the linear relationship with those variables. Analyzing the data was carried out using a structural equation model. During the first analysis, various modification indices and estimates have been suggested, and since then, the model has been fit once necessary changes have been made. The probability level is increased substantially based on the outcome of the modification indices and estimate. The evaluation indicators such as the goodness of fit, Comparative fit index (CFI), Goodness-of-fit index (GFI), root mean square error of approximation (RMSEA), and chi-square index/df were assessed. The significance level in all tests was considered 0.05. The obtained results are in the prescribed range, such as RMSEA= 0.038, Critical ratio= 1.96, GFI=0.992, CFI=0.998, TLI=0.992, NFI=0.989, IFI=0.998.
Keywords: Probability, Modification Indices, Root mean square error, Goodness of fit index.
Introduction
Chronic diseases are dangerous and risk for human beings infected by various diseases such as cancer, stroke and diabetes causes, leading death. Recent literature reported that around 463 million individuals aged 20 to 79 years (9.3% of the adult population) were estimated to have diabetes mellitus (DM) in 2019 globally [4]. It has been further predicted to increase to 700 million in 20245. The global epidemic of types diabetes mellitus has infected severely affected in the Middle East and northern Africa. Diabetes mellitus is a condition caused by the complex interplay of various factors simultaneously, with some having direct and some having indirect (i.e., mediator) effects. Several risk factors have been associated with type 2 diabetes: age, obesity, high blood pressure, lipid abnormalities, family history of diabetes, unhealthy diet, and physical inactivity [4]-[7]. The Mediterranean region is the second highest zone occurrence of types-2 diabetes in the world at 9.3 %.. [8.] In India, more than 74 million people are infected by diabetes mellitus, which may increase. The structural equation model has been found in scientific investigation to test and evaluate the multivariate causal relationship. SEM has been widely used for more than 100 years and has progressed more than three generations. [1]-[5]
Structural equation modeling (SEM) is, also called path analysis, is a very dominant multivariate technique that permits the measurement of both direct and indirect effects of variables and integrates models with numerous dependent variables by using several regression equations simultaneously, and hence, the present works involved with SEM to test a hypothesized model of variables affecting diabetes status for the pima dataset.
Materials and method
2.1 Data used
Pima Indian Diabetes database contains various factors such as the number of pregnancies the patient has had, their BMI, insulin level, age, and so on. The designed mode explores the linear relationship with those variables. To analyze, the number of variables in the model is 11, a number of observed variables is 9, number of unobserved variables is 2, the number of exogenous variables is 9, and the number of endogenous variables is 2. Observed endogenous variables are Pregnancies, Outcome, Observed, exogenous variables Glucose, Skin Thickness, Blood Pressure, Insulin, BMI, Age, Diabetes Pedigree Function, Unobserved, exogenous variables, E2, E1.
Methodology
The methodology started with a collection of datasets it contained independent and dependent variables. Initially, the model can be created by randomly giving regression weight from independent to dependent variables, and covariance has been shown between two independent variables. In most cases, maximum likelihood (ML) has been used for many application. SEM is commonly used for estimation and testing. The parameters that estimates are obtained by maximizing the likelihood function derived from the multivariate normal distribution. The model has been implemented in IBM SPSS AMOS. The medication index has been enabled to change the relationship between variables as per the suggestion given by the software. The methodology proceeded further since it provided a probability greater than 0.05. As per the estimates is concerned, it is suggested to change many relationship for example, the correlation has be given between age and Glucose, correlation between BMI and insulin, and glucose to E2. Like this modification has been made to decrease the chi-square variables.
Evaluating the Measurement Model Validity Measurement model validity is based on launching satisfactory levels of goodness-of-fit for the measurement model and finding evidence of construct validity. Multiple fit indices used to assess a model’s goodness of fit and should include: The Chi-square value and the associated degree of freedom, One absolute fit index (i.e., GFI, RMSEA, or SRMR), One incremental fit index (i.e. CFI or TLI), One goodness of fit index (GFI, CFI, TLI etc.), One badness of fit index (RMSEA, SRMR, etc)
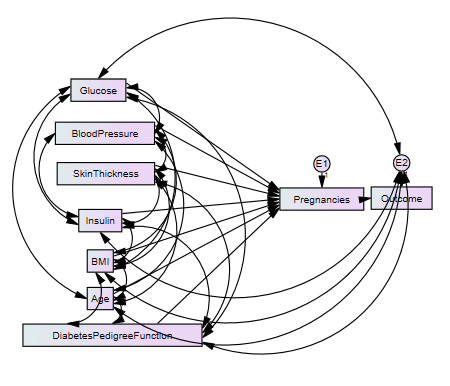
Fig 1 Structural equation model
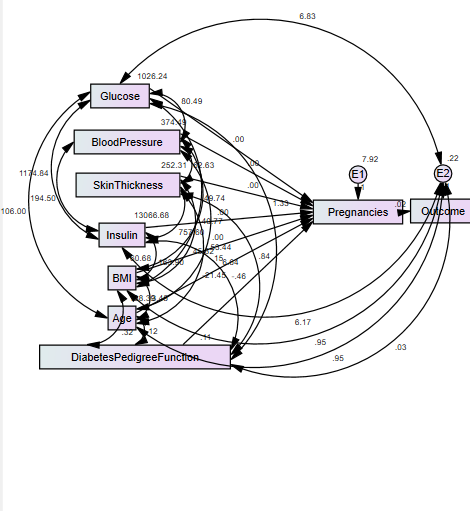
Fig 2 Estimated Structural equation model
Result and discussion
Structural equation model
The best fit model figure provided CFI =0.97, TLI=0.93, and RMSEA 0.032 was achieved after it had been done with adjustment. The modification index suggested various modifications like on headed regression or two-headed correlation between two variables, and the Minimum was achieved Chi-square = 9.760, Degrees of freedom = 5, Probability level = .082. From table 1 it is observed the calculated P value is 0.082, which is greater than 0.05, which specifies a perfect fit. Here Goodness of Fit Index (GFI) value (0.992) and Adjusted Goodness of Fit Index (AGFI) value (0.92) is greater than 0.9, which represent it is a good fit. The calculated Normed Fit Index (NFI) value (0.938). Further it is has been found that the Root Mean square Residuals (RMR) and Root Mean Square Error of Approximation (RMSEA) value is 0.038, which is less than 0.08, which indicates it is a perfect fit.
Table 1 Model fit summary of structural equation model
| S.no | Indices | Value | Suggested value |
|---|---|---|---|
| 1 | Chi-square value | 9.8 | - |
| 2 | Degree of freedom | 5 | - |
| 3 | P-value | 0.082 | > 0.05 ( Hair et al., 1998) |
| 4 | Chi-square value / DF | 1.32 | < 5.00 ( Hair et al., 1998) |
| 5 | GFI | 0.992 | > 0.90 (Hu and Bentler, 1999) |
| 6 | AGFI | 0.92 | > 0.90 ( Hair et al. 2006) |
| 9 | RMSEA | 0.038 | <0.08 ( Hair et al. 2006) |
Conclusion
The SEM is slightly more confirmatory than exploratory to test the relationship. It can integrate observed variables and latent variables. It allows a prior relationship with predictors rather than what is made manually. The result of the study suggested that women people with type 2 diabetes should be given accurate information to enhance their health outcomes. From the model, it is concluded that the calculated P value is 0.082, greater than 0.05, specifying a perfect fit. Here Goodness of Fit Index (GFI) value (0.992) and Adjusted Goodness of Fit Index (AGFI) value (0.92) is more significant than 0.9, which represents it is a good fit. The calculated Normed Fit Index (NFI) value (is 0.938). Further, it is has been found that Root Mean square Residuals (RMR) and Root Mean Square Error of Approximation (RMSEA) value is 0.038, which is less than 0.08 which indicates it is a perfect fit.
References
Arhonditsis GB, Stow CA, Steinberg LJ, Kenney MA, Lathrop RC, McBride SJ, Reckhow KH (2006) Exploring ecological patterns with structural equation modeling and Bayesian analysis. Ecol Model 192(3):385–409.
Bareinboim E, Pearl J (2015) Causal inference from big data: theoretical foundations and the data-fusion problem. Available via DIALOG. ADA623167. Accessed 11 Nov 2016.
Johnson JB, Omland KS (2004) Model selection in ecology and evolution. Trends Ecol Evol 19(2):101–108.
Kim KH (2005) The relation among fit indexes, power, and sample size in structural equation modeling. Struct Equ Modeling 12(3):368–390.
Lamb EG, Mengersen KL, Stewart KJ, Attanayake U, Siciliano SD (2014) Spatially explicit structural equation modeling. Ecology 95(9):2434–2442
MacCallum RC, Hong S (1997) Power analysis in covariance structure modeling using GFI and AGFI. Multivar Behav Res 32(2):193–210.
Sharma S, Mukherjee S, Kumar A, Dillon WR (2005) A simulation study to investigate the use of cutoff values for assessing model fit in covariance structure models. J Bus Res 58(7):935–943
Spearman C (1904) “General Intelligence,” objectively determined and measured. Am J Psychol 15(2):201–292
Get an email when we publish new research and open calls for chapters.
Create a free account