
Chapter 15
Managing Digital Liquidity Risk: An Integrated ALM, Stress-Testing and Governance Framework for Indian Banks
- Gayatri Praveen Chavali (Head of ALM, FTP & Liquidity Risk Management, Research Scholar, Department of Commerce and Management Studies Andhra University, Visakhapatnam, Andhra Pradesh, India)
- A Narasimha Rao (Professor, Department of Commerce and Management Studies Andhra University, Visakhapatnam, Andhra Pradesh, India)
- ISBN
- 978-93-340-5069-1
- Published
- 16 September 2026
- Accesses
- 19 views · 0 downloads
- Reading time
- ~22 min
Abstract
A bank’s deposit franchise reflects the markets it serves. An industrial zone may generate sizeable corporate balances, while another region builds its business around households and small enterprises. Applying the same concentration targets to both can overlook commercially valuable relationships. Yet profitability alone cannot justify funding exposures that the bank cannot withstand under stress. This chapter proposes an integrated framework for Indian banks that connects regional business plans, deposit behaviour, liquidity stress testing and bank-wide risk appetite. It draws on selected regulatory and supervisory publications and publicly disclosed bank practices. Regional portfolios are assessed by their economic drivers and contribution to aggregate funding needs, with central Treasury retaining responsibility for liquidity. A hypothetical example compares diversification, additional liquid assets and corporate-led growth. Under the stated assumptions, retaining corporate business with a larger buffer preserves more annual contribution than broad diversification, although a stronger withdrawal scenario makes both strategies insufficient against the chosen internal reserve. The result supports conditional business decisions rather than a universal preference for diversification. The chapter sets out allocation rules, management triggers and a research agenda for testing the framework with bank data. It offers a decision method, not an empirically validated model or a new regulatory requirement.
Keywords: Keywords: digital liquidity risk; asset liability management; risk appetite; regional banking; deposit behaviour; stress testing; profitability
Full text
1 Introduction
A regional manager may have sound reasons for pursuing corporate deposits. The local economy may be built around manufacturing, trading or a few major employers. Those relationships can support transaction income and lending opportunities as well as funding. A centrally imposed instruction to reduce concentration will have a cost if it requires the region to move away from the customers it understands best. The relevant question is how much concentration the bank can support, what that support costs and whether the relationship remains attractive after allowing for it.
The same question applies to a retail franchise. A large number of accounts does not, by itself, establish that balances will remain available during stress. Customers may share an employer, respond to the same interest-rate offers or withdraw together when confidence weakens. Digital access makes the assessment of withdrawal speed particularly relevant, but the presence of a mobile banking facility should not be treated as proof that a customer is unstable.
This chapter develops a practical way to connect these business considerations with asset liability management (ALM). Its central proposal is to assess regional funding exposures, test their combined effect and allocate risk-taking capacity within limits approved for the bank. Profitability enters the decision explicitly. Higher expected income can justify accepting some additional exposure, provided the bank can withstand the resulting stress and understands the cost of doing so.
The analysis focuses on Indian commercial banks within the scope of the RBI ALM Directions discussed below. Regional and zonal units are treated as internal management units of one bank. Overseas subsidiaries and other separate legal entities require additional analysis of transfer restrictions. The proposed framework is intended to strengthen decisions within existing arrangements; it does not assume that Indian banks lack ALCO oversight, stress testing or contingency funding plans.
2 Evidence and the problem being addressed
2.1 Lessons from observed stress
Silicon Valley Bank provides evidence of how funding structure, asset decisions and governance can interact. The Federal Reserve’s review identified concentrated uninsured deposits, interest-rate risk, weaknesses in management oversight and failed internal liquidity stress tests. Deposit outflows exceeded US$40 billion on 9 March 2023. The review also found that the bank lacked workable plans to access liquidity under stress (Board of Governors of the Federal Reserve System, 2023). These findings support examining a business model as a whole. They do not establish that every digital deposit franchise will experience similar withdrawals.
The Basel Committee’s assessment of the 2023 turmoil examined rapid outflows, funding concentration and impediments to using liquidity resources. Its discussion of Credit Suisse also highlighted entity-level resource allocation and operational demands on liquid assets (Basel Committee on Banking Supervision [BCBS], 2024). Cash availability therefore remains relevant, but it is one part of the wider relationship between deposit behaviour, funding capacity and management response. An inability to complete a payment at a particular time is not the central problem studied here.
For India, RBI’s April 2025 circular introduced an additional 2.5 percentage-point runoff factor for retail deposits enabled with internet and mobile banking, effective from 1 April 2026. The resulting factors are 7.5% for stable and 12.5% for less stable IMB-enabled retail deposits (Reserve Bank of India [RBI], 2025a). This establishes a specific regulatory treatment. It does not provide a forecast of withdrawals for an individual region or remove the need to examine customer behaviour.
2.2 Research approach and contribution
This is a conceptual chapter supported by documentary evidence and a transparent numerical illustration. Sources comprise RBI requirements, international supervisory analysis and two Indian banks’ public disclosures. The documents were reviewed for governance, behavioural risk, stress testing and funding preparedness. The bank disclosures are selected examples, not a representative sample. No interviews, confidential account records or observed regional profitability data are used.
The Financial Stability Board (FSB, 2013) distinguishes risk capacity, appetite, limits and actual risk profile, and places business-level decisions within the group context. Building on that distinction, this chapter proposes a regional application tied to funding needs and commercial contribution. Its contribution is the explicit decision sequence and worked trade-off. It does not claim to invent risk appetite allocation, behavioural ALM or stress testing, or to establish an unaddressed gap across the entire literature.
3 Regulatory foundations and disclosed bank practice
RBI’s Commercial Banks–Asset Liability Management Directions, 2025 provide the principal domestic foundation used here. Table 1 summarises selected obligations as reviewed on 15 September 2026. The Directions’ scope and any subsequent amendments must be checked for the institution concerned; separate categories of banks should not automatically be treated as subject to identical provisions (RBI, 2025b).
Table 1. Selected RBI requirements relevant to the framework
| Area | Selected requirement |
|---|---|
| Governance | Board responsibility for liquidity risk and explicit tolerance; policies reviewed at least annually. |
| Liquidity ratios | LCR and NSFR minimum 100% on an ongoing basis. Stress use of the LCR buffer below 100% entails immediate RBI reporting with reasons and corrective steps. |
| Stress and response | Regular bank-specific, market-wide and combined stress testing, supported by contingency funding arrangements. |
| Intraday management | Monitor payment-related liquidity and available resources within the applicable scope. |
Source: RBI (2025b). Selected provisions, not a complete compliance checklist. LCR: Liquidity Coverage Ratio; NSFR: Net Stable Funding Ratio.
The framework developed in the following sections is the author’s recommendation for implementation. Its regional budgets, illustrative reserve and profitability comparison are not prescribed RBI measures. International guidance is used for context, rather than presented as an additional Indian compliance obligation.
Published practice already provides a base on which such integration can be built. HDFC Bank’s March 2026 Pillar 3 disclosure describes ALCO oversight, cash-flow and stock approaches, liquidity stress testing and a contingency funding plan. City Union Bank’s corresponding disclosure describes an independent risk-management function, ALCO and policies covering ALM and stress testing (City Union Bank, 2026; HDFC Bank, 2026).
These disclosures establish that formal arrangements exist at the selected banks. They do not reveal the full detail of regional limit allocation, assumption calibration or commercial decision-making. Consequently, the chapter does not rank the banks or infer that a control is absent because it is not described publicly. A useful next step for research is to examine how these arrangements influence actual business approvals.
4 A framework from regional business to bank-wide appetite
4.1 Start with the economic source of the balance
The first task is to define a consistent view of the customer. Each account should connect to a customer identifier, related corporate group where applicable, product, currency, sector and responsible region. Regional ownership should reflect an agreed servicing or business rule. Booking location alone can misrepresent exposure when a company operates across several zones.
Useful behavioural fields include balance history, account activity, deposit maturity, renewal experience, digital access, pricing changes and the purpose of the relationship. A payroll operating account and a temporary corporate surplus may have similar balances on a reporting date but different funding implications. Customer segmentation should recognise this difference before applying a regional average.
An initial pilot could use two to three years of daily balances where available, supplemented by transaction and maturity records. That period is a practical starting point, not a sufficient sample of rare crises. The bank should identify missing periods, reconcile totals to the general ledger, retain closed accounts and prevent internal transfers from appearing as external funding gains or losses. Otherwise, business growth and account migration can distort estimates of stability.
4.2 Assess regions and shared exposures together
Table 2. Proposed assessment at three management levels
| Level | Risk view | Decision supported |
|---|---|---|
| Region or zone | Customer mix, seasonality, renewals and commercial contribution | Business plan and local stress budget |
| Across regions | Shared sectors, employers, groups and withdrawal triggers | Common exposure limits and aggregation |
| Whole bank | Consolidated cash needs, usable resources and earnings capacity | Appetite, liquidity support and growth approval |
Source: Author’s proposed framework. Regional allocations remain subject to bank-wide limits.
These views should use the same underlying records. A corporate group represented in three zones must remain identifiable as one common source of risk. Geographic spread does not justify a diversification benefit if the same industry shock drives all three sets of withdrawals. Conversely, a regional concentration need not be unacceptable where its drivers differ from the rest of the bank and its stressed demand remains supportable.
Regions should not be required to fund themselves independently. A deposit-rich zone may support lending elsewhere through central Treasury. Internal funding transfers and transfer-pricing entries must cancel in the consolidated view. Customer deposits should be counted once, and a centrally held liquid asset should not be credited in full to several regions at the same time.
4.3 Determine capacity before selecting appetite
Capacity is the boundary beyond which the bank cannot safely support its obligations under the assumptions being considered. Appetite is the exposure management chooses to accept within that boundary. The chosen position should leave room for forecasting errors, resource uncertainty and changes in the business. It should also remain consistent with capital, earnings, operational and regulatory constraints; liquidity capacity alone cannot authorise a business strategy.
Figure 1. Regional plans and the bank-wide approval cycle
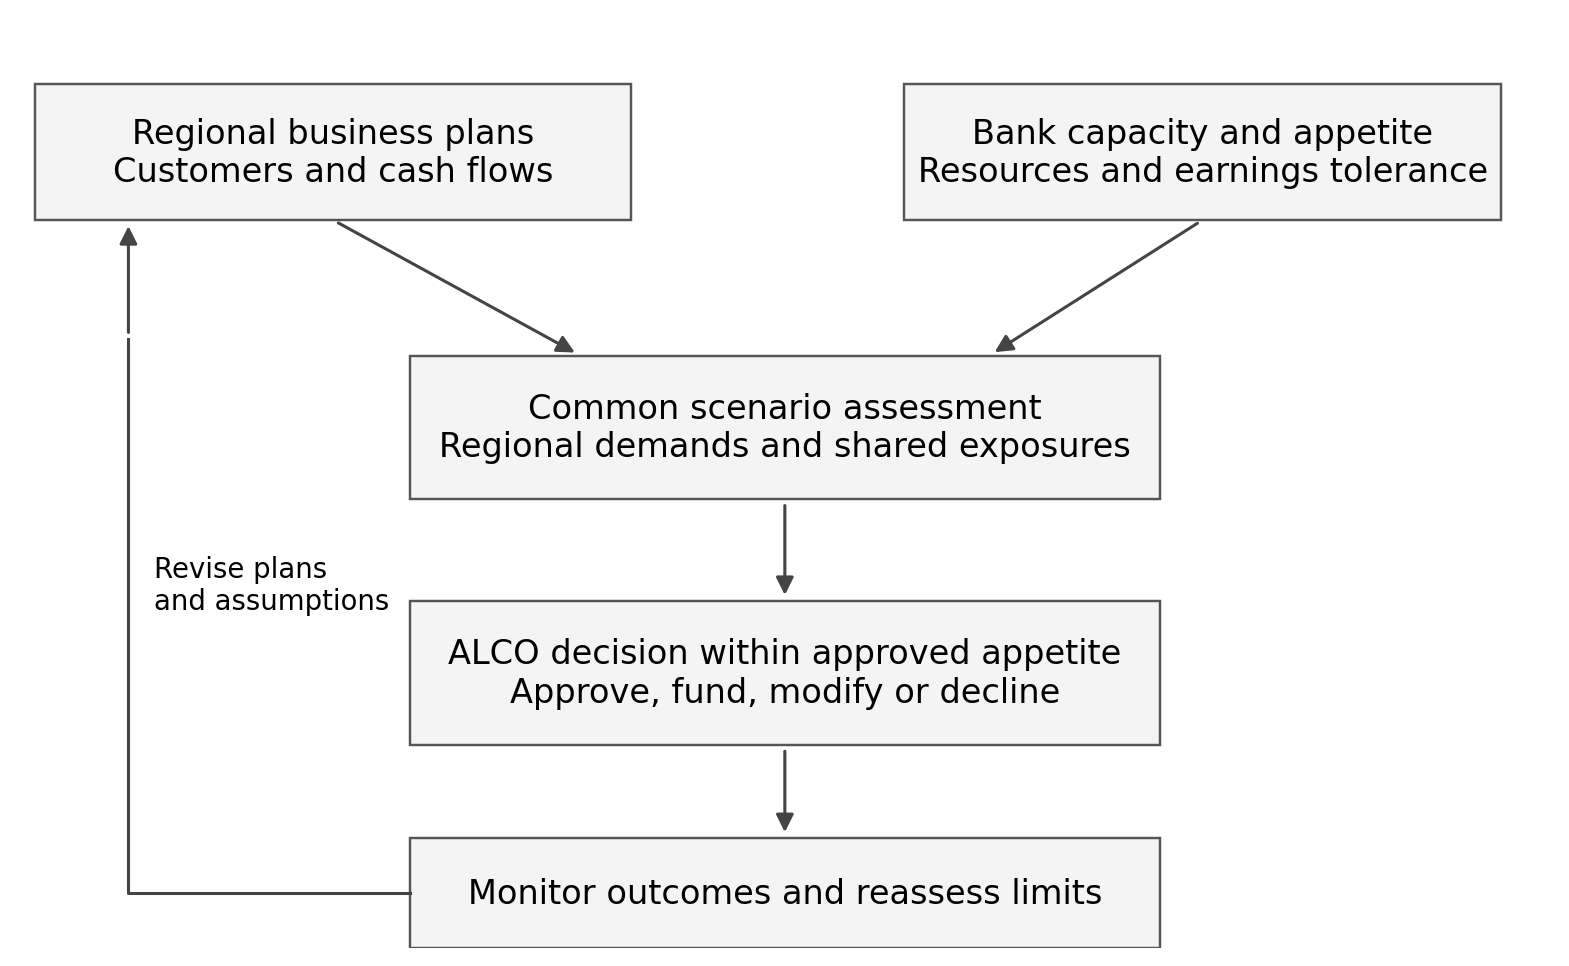
Source: Author’s proposed framework. Limits feed back into regional plans; monitoring can reopen an approval.
The proposed process starts with credible cash resources and adverse cash flows by currency and horizon. Treasury should assess liquid assets after relevant valuation adjustments and encumbrance, and recognise borrowing only when access, collateral and execution are credible. Selling an asset and borrowing against the same asset are alternative uses, not two sources of cash. Future extraordinary support should not be assumed available without a justified basis.
ALCO can then compare business plans against several candidate appetite settings. For each setting, the analysis should show stressed cash headroom, the cost of supporting liquidity and the earnings consequences of funding substitution. The Board chooses the acceptable trade-off in light of the bank’s strategy and capacity. No single formula can determine that preference objectively, and management should not increase a limit merely because the current plan breaches it.
A regional allocation can be expressed as a budget for its contribution to stressed funding demand, accompanied by limits on significant customer groups or common sectors. The allocation should reflect the region’s business opportunities and the bank’s aggregate exposure. It need not be proportional to deposits or identical across zones. Any initial diversification benefit should be conservative and supported by evidence that the exposures behave differently under stress.
4.4 Connect earnings with the resources required
For a business proposal, the relevant commercial measure is contribution after customer interest, operating costs, expected credit losses where applicable and funding costs, with fees included consistently. A separate adjustment can recognise the opportunity cost of the liquid assets needed to support the proposal. If that cost is already included in funds transfer pricing (FTP), it must not be deducted again.
FTP helps allocate funding costs and benefits between units; those internal entries disappear when assessing consolidated profit. This chapter uses FTP only as an allocation control. It does not propose a new pricing curve or a digital deposit charge. Regional performance should also distinguish costs the manager can influence from decisions made centrally, such as the bank’s buffer composition.
Stress-period funding costs should be presented separately from normal annual contribution unless a defensible probability model supports combining them. Subtracting the full cost of an extreme scenario from every year’s earnings would mix different concepts. Similarly, a liquidity-adjusted contribution is not risk-adjusted return on capital unless a justified capital denominator and the other relevant risks are included.
5 Stress testing and decision measures
The proposed scenario set includes a normal seasonal case, an adverse regional or sector case, a bank-specific confidence shock and a combined market and confidence shock. The assumptions should cover withdrawals, term-deposit non-renewal, committed facility drawdowns, slower asset receipts, replacement funding costs and weaker asset monetisation. Digital access affects the potential timing and coordination of withdrawals; it should not be the sole determinant of their size.
For each scenario, evaluate cash flows at short intervals during the initial phase, then daily and over longer planning horizons. A payroll cycle or a concentrated maturity date can matter more than the average monthly movement. Early withdrawals and non-renewal of the same deposit must not both be charged in full. Likewise, contractual loan receipts should be reduced where the same sector shock makes collection less certain.
The following equations define the proposed internal cash measure. For scenario s and time t, let B(s) be opening usable liquidity after scenario adjustments; F(s,t) cumulative additional external funding; I(s,t) cumulative asset and other external inflows; and O(r,s,t) cumulative external outflows assigned to region r, including centrally assigned flows where necessary.
C(s,t) = B(s) + F(s,t) + I(s,t) − Σᵣ O(r,s,t) (1)
H(s,t) = C(s,t) − M(s,t) (2)
Here C is projected cash remaining and M is the approved internal reserve. Positive H indicates room above that reserve. A negative H is an internal appetite breach; negative C indicates an unmet funding requirement under the scenario. All recognised resources must be available by the relevant time. These equations are internal cash-flow measures, not LCR calculations.
The bank should report the first time an internal reserve is breached separately from the first time cash becomes negative. Where no breach occurs within the test, the result should state that the bank remains above the threshold through the tested horizon. It should not infer an unlimited survival period. A regional stress budget can be tested by removing or adding the proposed business and measuring the change in aggregate need, using the same shared scenario throughout.
Reverse stress testing adds a useful management question: what withdrawal rate, funding loss or combination of events would exhaust the chosen headroom? The answer identifies a vulnerability and its proximity to current assumptions. It is not a probability of failure. Sensitivity analysis should also test whether a preferred strategy changes when buffer costs, deposit pricing or correlations are less favourable.
6 Illustrative regional trade-off
6.1 Portfolio and assumptions
Consider a hypothetical bank with INR 10,000 crore of deposits assigned to three regional portfolios. Table 3 gives deliberately simplified business profiles and assumed cumulative deposit outflows over 30 days. Every amount and behavioural assumption in this example is constructed for explanation. None represents an observed Indian bank, a calibrated forecast or an RBI runoff factor.
Table 3. Hypothetical regional deposit exposures
| Portfolio | Deposits | Runoff | Cash outflow |
|---|---|---|---|
| Retail-focused region | 4,000 | 8% | 320 |
| Corporate-focused region | 3,500 | 25% | 875 |
| Mixed-business region | 2,500 | 18% | 450 |
| Bank total | 10,000 | 16.45%¹ | 1,645 |
Source: Author’s assumptions and calculations. Amounts in INR crore; 30-day cumulative outflows. ¹Weighted aggregate rate, not an additional assumption.
The bank has INR 2,300 crore of opening usable liquid resources, already measured net of assumed valuation adjustments. Other cumulative net cash outflows are INR 355 crore, covering non-deposit payments and facility drawdowns after asset receipts. There is no additional borrowing in the example. Total stressed cash use is therefore 1,645 + 355 = INR 2,000 crore, leaving INR 300 crore. The illustrative internal reserve is INR 400 crore, so the current plan falls short of the chosen reserve by INR 100 crore while still retaining positive cash.
The reserve of 400 is an assumed Board choice for this example, not a recommended percentage. In an application, its justification would have to include forecast errors, payment needs, uncertainty in funding access and the bank’s willingness to absorb stress. The numerical comparison is a 30-day endpoint test. It cannot establish intraperiod survival without the corresponding dated cash flows.
6.2 Compare feasible commercial responses
Three alternatives are assessed alongside the existing plan. Diversification replaces INR 1,000 crore of corporate deposits with retail deposits at unchanged total funding and assets. Supporting concentration retains the deposit mix but reallocates INR 200 crore from earning assets into additional liquid assets. Corporate-led growth adds INR 1,000 crore of corporate deposits and matching earning assets while leaving the opening buffer unchanged. For simplicity, neither the additional earning assets nor the assets displaced by the larger buffer produce net cash receipts during the stressed 30 days.
Annual contribution before buffer opportunity cost is assumed to be INR 200 crore for the existing plan. Diversification reduces it to INR 188 crore through a combined net effect of acquisition, servicing, pricing and relationship-income changes. Corporate growth increases it to INR 220 crore. Supporting concentration uses the same pre-buffer benchmark of 200; the earnings effect of reallocating assets is captured entirely in the larger buffer cost.
An annual net opportunity cost of 2% is applied to the liquid asset amount. This is an assumed difference in net contribution between the liquid assets and the displaced alternative uses after relevant ordinary costs. It is not a current market yield, an interest expense on cash or a regulatory charge. Thus, 2,300 × 2% = INR 46 crore is deducted for the existing buffer, and 2,500 × 2% = INR 50 crore for the larger one. The same cost is not embedded elsewhere in the assumed pre-buffer contribution.
Table 4. Profitability and liquidity under the main scenario
| Measure | Existing plan | Diversify | Support concentration | Corporate growth |
|---|---|---|---|---|
| Retail deposits | 4,000 | 5,000 | 4,000 | 4,000 |
| Corporate deposits | 3,500 | 2,500 | 3,500 | 4,500 |
| Mixed deposits | 2,500 | 2,500 | 2,500 | 2,500 |
| Opening liquidity | 2,300 | 2,300 | 2,500 | 2,300 |
| Total stressed cash use | 2,000 | 1,830 | 2,000 | 2,250 |
| Cash remaining | 300 | 470 | 500 | 50 |
| Headroom above 400 reserve | −100 | 70 | 100 | −350 |
| Annual contribution before buffer cost | 200 | 188 | 200 | 220 |
| Annual buffer cost | 46 | 46 | 50 | 46 |
| Annual contribution after buffer cost | 154 | 142 | 150 | 174 |
| Meets endpoint reserve | No | Yes | Yes | No |
Source: Author’s hypothetical illustration. All amounts in INR crore. Annual earnings and 30-day cash measures have different horizons. Compliance with LCR, NSFR and other constraints is not calculated.
Both diversification and additional liquidity meet the illustrative endpoint reserve under the main scenario. Supporting concentration retains INR 150 crore of annual contribution, compared with INR 142 crore under diversification. It sacrifices INR 4 crore relative to the existing plan and adds INR 200 crore of stressed cash headroom. In this constructed comparison, that is a less costly way to bring the business within appetite. Corporate growth generates the highest contribution but leaves only INR 50 crore, which does not meet the chosen reserve.
Under supporting concentration, the usable stress capacity above the reserve is 2,500 − 400 = INR 2,100 crore. An illustrative allocation is 340 to retail, 900 to corporate and 460 to mixed business, plus 355 for central net outflows and 45 retained centrally as unallocated capacity. These budgets total 2,100. The regional demands of 320, 875 and 450 fit within them, leaving regional headroom of 55 and central unallocated capacity of 45. The combined headroom is the same 100 shown in Table 4. These allocations are illustrative management choices, not optimised limits; they show how unequal regional budgets can remain consistent with one bank-wide constraint.
The result is conditional. It does not establish that corporate concentration is generally preferable or that a small buffer increase solves every funding problem. A changed retail acquisition cost, lower relationship income or higher cost of holding liquid assets could alter the ranking. The decision must also consider credit concentration and capital use, which are held outside this simplified comparison.
6.3 Challenge the preferred decision
Increase the corporate withdrawal assumption from 25% to 35%, leaving other assumptions unchanged. Stressed cash use becomes INR 2,350 crore under the existing plan, INR 2,080 crore under diversification and INR 2,350 crore under supporting concentration. Remaining cash is respectively minus INR 50 crore, INR 220 crore and INR 150 crore. All three now breach the 400 reserve; the existing plan also has a funding deficit. Diversification provides more cash protection than the larger-buffer strategy under this sensitivity.
A reverse calculation makes the boundary clearer. With retail and mixed outflows unchanged, the supporting-concentration strategy reaches its reserve when corporate runoff equals (2,500 − 400 − 320 − 450 − 355) / 3,500 = 27.86%. Diversification reaches its reserve at (2,300 − 400 − 400 − 450 − 355) / 2,500 = 27.80%. Neither decision has much room beyond the assumed 25% corporate runoff. If the 35% case is a required appetite scenario, neither qualifies without further changes.
The bank could evaluate combinations of a different deposit mix, a larger buffer, credible additional funding and moderated asset growth. These should be costed together. Under the 35% case, supporting concentration would need at least another INR 250 crore of usable resources to restore the 400 reserve at the endpoint. Whether to acquire that support or change the business is precisely the decision the framework is intended to inform.
7 Governance and implementation
The proposed allocation process begins with regional business plans and ends with an explicit approval, modification or rejection. Regional managers supply relationship information, identify expected seasonal movements and explain commercial opportunities. Risk independently challenges behavioural assumptions and common exposures. Treasury confirms resource availability and funding execution. Finance reconciles commercial contribution and prevents duplicate allocation of funding costs.
ALCO should review the consolidated result and recommend limits consistent with Board-approved appetite. A profitable region may receive additional capacity, but the approval should identify the funding support, its cost and the conditions under which that capacity will be withdrawn. Where existing business already exceeds appetite, the response should include a credible transition plan rather than assume immediate customer replacement.
Table 5. Proposed management responses
| Finding | Required decision | Accountability |
|---|---|---|
| Region exceeds its stress budget | Change the plan or obtain a supported reallocation | Regional business and ALCO |
| Shared sector exposure rises | Review the combined position across zones | Risk and ALCO |
| Approved cash reserve is breached | Revise funding, buffer or growth plans; escalate within mandate | Treasury and ALCO |
| Assumptions repeatedly understate outflows | Recalibrate, document overlays and review affected limits | Risk and model validation |
| Funding action fails an execution test | Remove unsupported capacity and revise contingency arrangements | Treasury and operations |
Source: Author’s recommendations. Material changes to Board-approved appetite require approval through the bank’s governance process.
The thresholds in an operating dashboard should come from approved scenarios and capacity assessments. An amber trigger might require review before a limit is breached, based on deteriorating renewal rates or a growing concentration. Red status should follow a defined breach or evidence that a relied-upon resource is unavailable. The exact thresholds and response times require bank-specific approval; assigning arbitrary percentages would add apparent precision without justification.
A pilot can begin with a retail-focused region and a corporate-focused region, reconciled to the same bank-wide cash position. The first stage establishes data ownership and economic mappings. The second runs behavioural assumptions, cash projections and profitability comparisons in parallel with existing reports. The third tests whether the resulting decisions are understandable, executable and consistent with the bank’s other limits. Only then should the bank link the results to wider business planning or performance incentives.
8 Validation and future research
The illustration verifies a decision logic, not predictive accuracy. Empirical validation should begin with observed daily outflows, deposit renewals and funding costs, using a development period followed by a separate holdout period. Models should be compared with a simple product-level benchmark. A more complex regional model is worthwhile only if it improves estimation or decisions sufficiently to justify its data and maintenance requirements.
Several measures are useful: error in cumulative net outflows, frequency and size of underestimation, warning lead time and the frequency with which planned funding proves unavailable. Regional errors should be inspected individually because overprediction in one zone can conceal underprediction in another. Rare-event scenarios require judgement and external evidence alongside back-testing; ordinary periods cannot validate the severity of a confidence run.
Further research should test whether geography adds explanatory value after controlling for customer type, sector, corporate group, balance size, pricing and account activity. Regional labels may capture genuine economic differences, or merely reproduce the customer mix already measured elsewhere. This distinction determines whether regional limits improve the framework or simply add another reporting layer.
A second study could examine the stability of customer withdrawal relationships across interest-rate regimes and seasonal cycles. Panel or hierarchical models could accommodate differences between regions while sharing information where samples are limited. Correlation estimates should be challenged under common shocks, with explicit tests for concentrated employers, industries and linked corporate groups. Any digital-access effect should be separated, as far as the data allow, from differences in customer characteristics.
A third research direction is to evaluate actual management decisions. Did the framework change a funding plan, avoid an unsupported growth commitment or improve the timing of an escalation? Did it preserve contribution after the cost of additional liquidity? A prospective pilot with documented decisions would be more informative than fitting a model retrospectively and assuming every warning would have been acted upon.
Finally, the profitability comparison should be extended to credit risk, capital consumption, deposit-rate responses and the interaction between interest-rate risk and liquidity. The current example cannot quantify a capital benefit, a reduction in failure probability or realised earnings improvement. Such claims require bank data and an appropriate evaluation design. All proposed studies should use authorised, suitably anonymised records and retain an auditable distinction between estimated results and management overrides.
9 Conclusion
A bank should be able to explain why a concentrated regional business is worth retaining and how it will support that exposure when conditions deteriorate. Equally, it should recognise when the cost of that support makes the business unattractive. A uniform diversification target cannot settle these questions. Regional opportunity, common economic exposures and bank-wide funding capacity have to be considered together.
The proposed framework connects those considerations through common data, scenario-based cash needs, commercial contribution and accountable approvals. Its illustration shows that additional liquid assets can preserve more contribution than broad diversification under one set of assumptions. A stronger withdrawal case then demonstrates the limits of that choice. Both outcomes matter: risk appetite should identify what the bank is prepared to withstand and when its business plan needs to change.
For implementation, the immediate task is a controlled pilot that reconciles two contrasting regions to the bank’s aggregate position and records how the analysis affects decisions. For research, the priority is to test behavioural assumptions and commercial outcomes with observed data. The value of the framework will ultimately depend on whether it helps a bank take risks it understands, can support and is adequately rewarded for accepting.
References
Basel Committee on Banking Supervision. (2024). The 2023 banking turmoil and liquidity risk: A progress report. Bank for International Settlements. https://www.bis.org/publications/2023-banking-turmoil-and-liquidity-risk-progress-report.pdf
Board of Governors of the Federal Reserve System. (2023, April 28). Review of the Federal Reserve’s supervision and regulation of Silicon Valley Bank: Key takeaways. https://www.federalreserve.gov/publications/2023-April-SVB-Key-Takeaways.htm
City Union Bank. (2026). Basel III–Pillar 3 disclosure as on March 31, 2026. https://cityunionbank.bank.in/ta-in/filemanager/May26/Pillar%203%20disclosure%20-%20Website.pdf
Financial Stability Board. (2013, November 18). Principles for an effective risk appetite framework. https://www.fsb.org/2013/11/r_131118/
HDFC Bank. (2026). Basel III–Pillar 3 disclosures as at March 31, 2026. https://www.hdfc.bank.in/content/dam/hdfcbankpws/in/en/pdf/regulatory-disclosures/2026/basel-iii-pillar-3-disclosures-as-at-march-31-2026.pdf
Reserve Bank of India. (2025a, April 21). Basel III framework on liquidity standards–Liquidity Coverage Ratio (LCR)–Review of haircuts on High Quality Liquid Assets (HQLA) and review of composition and run-off rates on certain categories of deposits. (DOR.LRG.REC.18/03.10.001/2025-26). https://www.rbi.org.in/Scripts/NotificationUser.aspx?Id=12836&Mode=0
Reserve Bank of India. (2025b, November 28). Reserve Bank of India (Commercial Banks–Asset Liability Management) Directions, 2025. (DOR.LRG.No.82/13-10-001/2025-26). Retrieved September 15, 2026, from https://www.rbi.org.in/Scripts/BS_ViewMasDirections.aspx?id=13147
Get an email when we publish new research and open calls for chapters.
Create a free account